JeffBet by Dr Catalin Barboianu PhD |
Date of Publishing: 10 October 2023

How to Unlock the Secrets of PAR Sheets for Slot Mastery

neww-Secrets-of-PAR-Sheets-for-Slot-Mastery-gudie

Slots are the most popular casino games today despite the mystery surrounding their inner design. For modern electromechanical slots or virtual-reel slots, players do not know what is behind the sparkling cases and the colourful interfaces, that is, how the machine is configured on its reels and what to expect from it. This information is not made public by the developer or the operator. Consequently, they do not know statistical information about a machine, that is, how frequent each winning combination is hit and what is the average return (with some exceptions for the latter indicator, which is exposed on some machines). This hidden information is written in the so-called PAR sheets, internal confidential documents that come along with a machine when commercially distributed. PAR sheets are hardly retrievable, and when you find one, the question is how to read that information, which looks like written, encoded and addressed to experts.

In this article, we will see what a PAR sheet is, how to read and interpret its information as a non-expert, and how to use it for playing informed.

What is a PAR sheet?

When a slot game is designed, game mathematicians work to conceive the game to be original and attractive and to ensure the operator’s profit in the long run. This math work reverts to choosing the parameters of the game such that to fit the producer’s desired features and statistical indicators. These parameters are: the number of unique symbols to show on the reels, the number of reels, the weighting of the reels (how many instances of each symbol are on each reel), the number of paylines, and the credit options (one or several coins/denominations). The choice of these parameters results in precise statistical indicators reflecting how the machine will behave in the long run, in the form of statistical averages, of which the most important for the operator (but also for the players) are the RTP (the payback percentage), the hit frequencies, and the volatility index. Each choice for the parameters identifies a unique configuration, that is, a unique slots game.

All these parameters and statistical indicators are noted in the PAR sheet of the game, abbreviation for Probability and Accounting Report. The PAR sheet is a kind of blueprint of a slot machine.

A PAR sheet is written so as to contain minimal information, that is, it does not expose all the mathematical work behind the choices, but just the final numbers, and customarily follows a predetermined format and structure.

Secrecy and retrieval of PAR sheets

While no gambling regulation imposes slots producers to make public the PAR sheets of their games (and this is true in all jurisdictions all over the globe), there is no rational justification for their secrecy either. Protecting any trade secrets or intellectual ownership against competition cannot be invoked as a rational reason since the parametric configuration of a slots game is essentially applied mathematics, and math formulas and patterns are freely available and cannot be patented. Besides, no competitor would be interested in copying (stealing) a game, exposing themselves to bad publicity from a competitor or neutral entities.  

An argument related to players’ behaviour is also not justified since slot players continue to play slots in the absence of information regarding parametric configuration, probabilities, and statistical indicators of the games, maintaining the popularity of these games. And even if this information were exposed, there is no evidence that players would avoid slots due to the low odds of winning. It is an undeniable fact that gamblers play against low odds even when they know them and the best example is a lottery.

Retrieving PAR sheets is a difficult task, and such attempts, although successful, were a marginal phenomenon. Gambling experts and researchers retrieved PAR sheets through legal intervention, invoking the freedom of information. Other PAR sheets came to be exposed by leaks of documents from inside the producers’ companies.

There were companies that voluntarily put some PAR sheets at experts’ disposal upon request, and some also made them public. For instance, Bally Gaming published very many years ago a batch of PAR sheets of their old games on an internet archive.

I am also using one of their sheets as an example in this article to explain what the deal with PAR sheets is (it’s about the game DJ Diamond/Mixed Bars/Sevens).

neww-Secrets-of-PAR-Sheets-for-Slot-Mastery-gudie-blog

Structure and format of a PAR sheet

A PAR sheet usually has a maximum of 3-4 pages, depending on how many reels and paylines that machine holds. The information contained is comprised in tables, and the statistical indicators’ numerical values are not backed up with math computations. 

The header

The sheet has a header where the game is noted with its name and a code or as an acronym. The header also mentions the credit/wager options (how many coins you can wager: 1 coin, 2 coins, 3 coins, etc.). The RTP information is also noted in the header for the minimal and maximal credit. 

Here is how the header looks in our example:

guide-image-Picture1

The hits and payout table

The first table in the sheet lists the winning combinations of symbols in its left-hand side (labelled Symbols). These are the combinations for which the machine pays out. These combinations are noted with the symbols encoded (abbreviated). The reels are labelled as R1, R2, R3, and so on. The codes of the symbols are defined in the last table of the sheet. In this first table, the winning combinations are written with individual symbols (for instance, B7 means ‘Blazing Seven’) or multiple symbols (for instance, XB means ‘Any Bar’, i.e., Single, Double or Triple bar).

The next portion of the table holds important information: how the reels are weighted with the winning combinations. For each winning combination, it shows on the group of columns labelled Factors, how many instances of each symbol in that combination are on each reel. The column labelled Total Hits notes for each combination the number of the combinations of stops holding those symbols. In other words, how many times that combination would be hit if the machine went through a full cycle with each combination of stops occurring once? As such, the number in the column Total Hits is the product of the values in the Factors columns (one for each reel).

guide-image-Picture2

The Minus column is populated only for the combinations with multiple symbols; in our example, the XB (Any Bar) symbols. Since such a combination unfolds in combinations of individual symbols, the value in the Total Hits column counts these individual symbols more than once. The negative value in the Minus column corrects this number for getting the number of unique combinations of stops holding those individual symbols.

guide-image-Picture3

In the last row of the table are noted the totals of these hits. In our example, 337,616 is the number of actual combinations of stops providing winning combinations.

The information in this portion is the most important because it is used to compute all the game’s statistical indicators and the probabilities of the winning combinations.

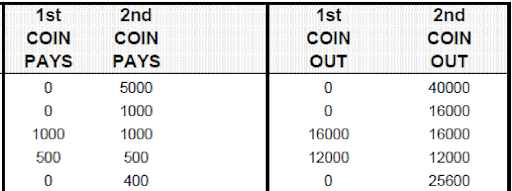
The next two portions of the table are dedicated to the payouts. The first two columns (labelled…Coin Pays) note the payout rate for each winning combination and for each denomination. We can see in the capture below that the top award combination only pays out for two coins, with a rate of x5,000. The payout portion of the table it is actually the same information that is displayed as the payout schedule in the paywindow of the machine and the only information in the PAR sheet that every player knows.

The last two columns (labelled …Coin Out) note the total payouts for each winning combination for a full cycle. These values are obtained by doing the product between the actual hits value and the payout rate. The grand totals of the payouts are noted in the Totals row.

guide-image-the-grand-total

The information in the hits and payout table along with the number of stops of the reels (noted in the last table of the sheet) reflects the entire inner design of the game and contains all the parameters necessary for the statistical calculations.

guide-image-maximum-denominantion

In our example, the outcome of the game occurs on one payline. For more complex games with several paylines, the table extends with additional columns in its last two portions, associated with the paylines, as the payout rates are usually different for each payline.

The RTP table

The next table summarises the previous table’s totals and shows the machine’s RTP. 

guide-image-show-the-match-rtp

The Hit % column notes the hit frequency values for each denomination, that is, the ratio between the total actual hits of the winning combinations and the full cycle (the product of the number of stops on every reel). It reflects as a percentage how many times, in average, one can hit a prize.

The last column (labelled Pay %) notes the RTP for each denomination. For some machines the RTP is also displayed in their About/Help menu.

The averages table

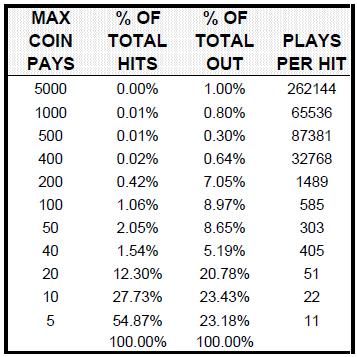
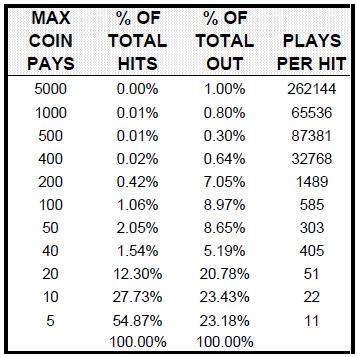
The next table in the sheet notes basic statistical results regarding the hits and total payout associated with each payout rate for the maximal denomination.

guide-image-90persent

In the first column are the payout rates of the winning combinations. In the second column is the share of the hits associated with each payout rate from all actual hits (the ratio between the number of actual hits for the combinations that pay out at that rate and the total number of actual hits; these values are noted in the hits and payout table). In the third column is the share of the total payout associated with a payout rate from the total payout of the machine. The last column notes the average number of plays required for a hit to occur for each payout rate.

All the values in the second to fourth column are statistical averages.

The volatility table

The next table notes the volatility index for several round numbers of pulls (spins), and  the lower and upper values of the actual RTP, under a confidence interval of 90%.

The volatility index is a statistical indicator that is mostly the concern of the operators rather than players. However, it is often a criterion of choosing a game for the informed players. It reflects the average frequency and size of the payouts on a machine; the bigger its value, the more volatile the machine is. The confidence interval is the probability that the payback and hold percentages will fall within the parameters set by the producer (usually a 90% or 95% probability is set).

The symbols table

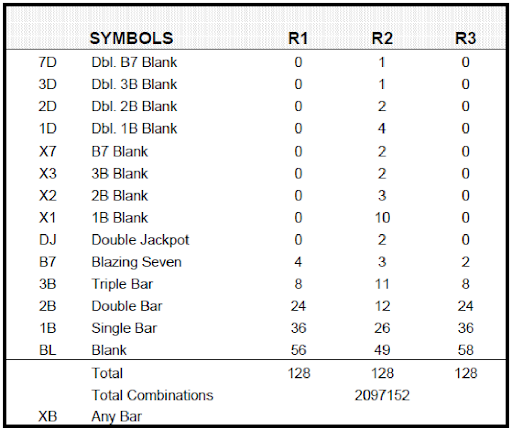
Finally, the last table describes the symbols used in the game and notes their individual weighting on each reel. 

guide-image-the0symbol-table

The first column shows the codes of the symbols in the PAR sheet, and the columns labelled R1, R2, R3, and so on, note the number of instances of each symbol on each reel (that is, how many stops hold a particular symbol on each reel).

The Total row actually shows the number of stops of each reel, and the Total combinations row show the full cycle of the machine, which is the product of the number of stops on each reel (128 x 128 x 128 in our example).

Our example presents a virtual reel machine. For machines with virtual reels mapped onto physical reels, there is an additional table in the PAR sheet showing how the symbols are mapped (how many instances of a particular symbol on the virtual reel are mapped onto the number of instances of that symbol on the physical reel).

Computing the statistical indicators and probabilities

Now that we know what a PAR sheet contains and how it is structured let’s see how the main statistical indicators are computed using the values in the tables of the sheet. Knowing about these operations will strengthen your knowledge about how a slots machine works and the rationale behind its parametric configuration.

The payback percentage or RTP, the main criterion of choosing a machine (in the condition of lacking other information) is shown in the RTP table in the Pay % column. It is simply the ratio between the Total Out value and the Total in value. 

RTP = Total Out / Total in

In our table: For one coin, 1,953,680 / 2,097,152 = 93,16%.

The volatility index is computed as a weighted sum, whose terms are the payout of each possible combination of symbols (0 to the maximal prize) multiplied by its average frequency. These parameters are noted in the averages table. This sum, operated for a certain number of pulls, will provide the volatility index of the machine associated with that number of pulls.

For the lower and upper limit of the payback percentage for each number of pulls, the computation is a bit more complicated and the statistically inclined people will understand it right away as they are more familiar with the notions involved. The formula for these limits under a 90% confidence interval is:

Lower Limit (%) = RTP-VI/√N

Upper Limit (%) = RTP+VI/√N

where RTP is the standard payback percentage (noted in the RTP table), VI is the volatility index, and N is the number of pulls.

For example:

In our volatility table, for N = 10,000 pulls, the volatility index is VI = 11.236 (for the maximal denomination). Let’s compute the lower and upper limits of the RTP:

Lower Limit (%) = 95.26% – 11.236/100 = 95.26% – 11.23% = 84.02%

Upper Limit (%) = 95.26% + 11.236/100 = 95.26% + 11.23% = 106.49%.

We will see in the next section how to interpret these limit values. 

Finally, how are the probabilities of winning computed? Probabilities are not noted in the PAR sheet, but their deduction is immediate:

For every winning combination, its probability of occurrence is the ratio between the associated actual hits and the full cycle.

Probability = Actual hits / Full cycle

Examples in our sheet:

B7 7D B7 (the top award combination) has 8 actual hits (in the hits and payout table) out of 2,097,152 possible combinations of stops (full cycle, in the symbols table). Then, its probability is:

P(B7 7D B7) = 8 / 2,097,152. This is 1 to 262,144. Pretty low, right?

XB 3D XB has 4,560 actual hits out of a 2,097,152 full cycle and as such:

P(B7 7D B7) = 4,560 / 2,097,152 = 0.00217 = 0.217%. Still minute.

The probabilities of winning are important information to consider, and for many players it should me more important than the RTP, especially for those playing short to medium sessions. Besides, by putting together the probability of winning and the payout rate of a combination, one can evaluate how “fair” is a machine, regardless of its RTP. In our example above, the top-award combination has a payout rate of only x5,000, for an average hit frequency of one in over two hundred thousand.

Let’s do it for the most frequent winning combination: XB XB XB. 

P(XB XB XB) = 185,264 / 2,097,152 = 8.83%.

About 9% probability of winning with x5 payout rate.

The adequate interpretation of the statistical values in a PAR sheet

Once you’ve got a PAR sheet and know how to decipher it, using that information correctly in your play is not sufficient. For the correct understanding of the statistical facts presented in the PAR sheet and how they relate to the actual play, it is necessary to adequately interpret the statistical notions whose values are noted in the sheet.

The most important thing to retain is that all the statistical results are statistical averages, which do not apply to predetermined numbers of pulls/spins. In theory, such averages only apply to an infinite number of spins. RTP and probabilities work that way.

A 95% payback percentage does not mean that the machine will pay back you 95% of your wagers over 1,000 or 10,000, or even 1,000,000 of pulls. It is just an indicator associated with the machine, meaning that it will pay back in that percentage cumulatively to all players (as a limit), over the long run.

A probability of hitting a certain combination of 9% does not mean that you will hit it in precisely 9 out of 100 pulls but as an average over an assumed infinite number of pulls. The same stands for the values of the hit frequency and the share of a payout rate from the total hits, which are shown in the PAR sheet.

The values in the volatility table apply for definite numbers of pulls, but they still are statistical averages. That table is actually a chart made to evaluate if the machine is performing as the producer intended.

For example, say that a player inserts a £100 bill as a credit on the machine in our example. The theoretical payback percentage is 93.16%. If the machine behaves perfectly, the player should have £93.16 left over in credits before leaving. The casino would have made £6.84 based on the theoretical RTP. But this does not happen in the real life. Assume that over 100,000 games on the machine. The casino only holds 4% instead of 6.84%. The question is, given the information provided by the producer, is it acceptable to have a 4% hold rather than a theoretical hold?

With a 90% confidence interval provided by the producer, for 100,000 pulls, the casino will hold between 1.19% and 8.29%, according to the volatility table (1 minus the upper limit and 1 minus the lower limit). Therefore, it is likely that the machine in this example is performing within expectations, given the volume of play.

Knowing about the data that a PAR sheet contains, how the results are obtained, and their interpretation is a good and practical way to learn about the basic mathematics of slots without using advanced resources.

Playing informed is one of the main requirements of responsible play. In the case of slots, information is not easily accessible, and public PAR sheets are very rare. Yet even if you don’t have the PAR sheet of your favourite slots game, studying and understanding the sheets of other games helps you create a realistic image of the deal with slots.

Source of the PAR sheet:

https://web.archive.org/web/20051215075839/http://ballygaming.com:80/media_library/pcsheets/8209.pdf 

About the Author

Author: Dr Catalin Barboianu PhD

Catalin Barboianu PhD is a games mathematician and problem-gambling researcher. He authored ten books on gambling mathematics and several academic articles in the field of problem gambling and philosophy of science. Catalin is a science writer and consultant for the mathematical aspects of gambling for the gaming industry and problem-gambling institutions. Read More


Related Guides

How-to-Play-Roulette-384x260

How To Play Roulette – Guide For Beginners

How to Play Roulette Roulette, meaning ‘little wheel’ in French, is one of the most popular and entertaining casino games in the world. There are so many variations and betting options – it’s easy to see why the title is such a crowd-pleaser. Here at JeffBet, we aim to bring the real casino experience to […]

Continue Reading...

How-to-Play-Blackjack-384x260

How To Play Blackjack – Guide For Beginners

How to Play Blackjack There aren’t too many rules for playing blackjack, compared to poker for instance. This is one of the many reasons why players have enjoyed this casino table game for over 250 years! With a fairly low house-edge and various opportunities to strategize, there is no sign of popularity for this casino […]

Continue Reading...

How-to-Play-Baccarat-384x260

How To Play Baccarat – Guide For Beginners

How to Play Baccarat Whether it’s the famous scenes in the 007 spy movies, or you’ve seen it being played at a land-based casino – baccarat is one of the most popular games of chance around. This casino game has been played for more than 600 years and it’s never been easier to access from […]

Continue Reading...